
DDD (#3): Bear Market Knowledge & Extremely (Good?) Fear
A quick fix of the latest financial happenings.

Good morning, investors!
If this is your first time with us, don’t forget to subscribe here. If you enjoy today’s issue, please hit the heart button at the end of the report.
Without further ado…
One Stat About Bear Markets to Keep in Mind
On Monday, we officially entered a bear market, as the S&P dropped below the arbitrary 20% threshold. It’s certainly not the first bear market of the century — it’s not even the first of the decade (although the pandemic downturn was the shortest on record, it was still a bear).
In light of this new bear, here’s a stat to keep in mind as we anxiously wait for the bulls to come home:
The typical bear market takes 3.1 years to completely recover, dating back to 1929.
But, in terms of length, every bear market is different.
The COVID-19 bear took 6 months to recover.
The housing market crash took 5.5 years to recover.
The dot-com bubble burst took 7.2 years to recover.
As the adage goes, past performance is no guarantee of future results — but the key takeaway is that we may be in rough waters for a considerable amount of time.
Or maybe we won’t be?
Two Words of Encouraging Market Sentiment: Extreme Fear
A bear market typically doesn’t inspire much confidence. According to CNN’s Fear & Greed Index, which is a compilation of seven technical indicators like the 125-day moving average of the S&P 500 and the 5-day average put-to-call ratio, stock investors are extremely fearful.
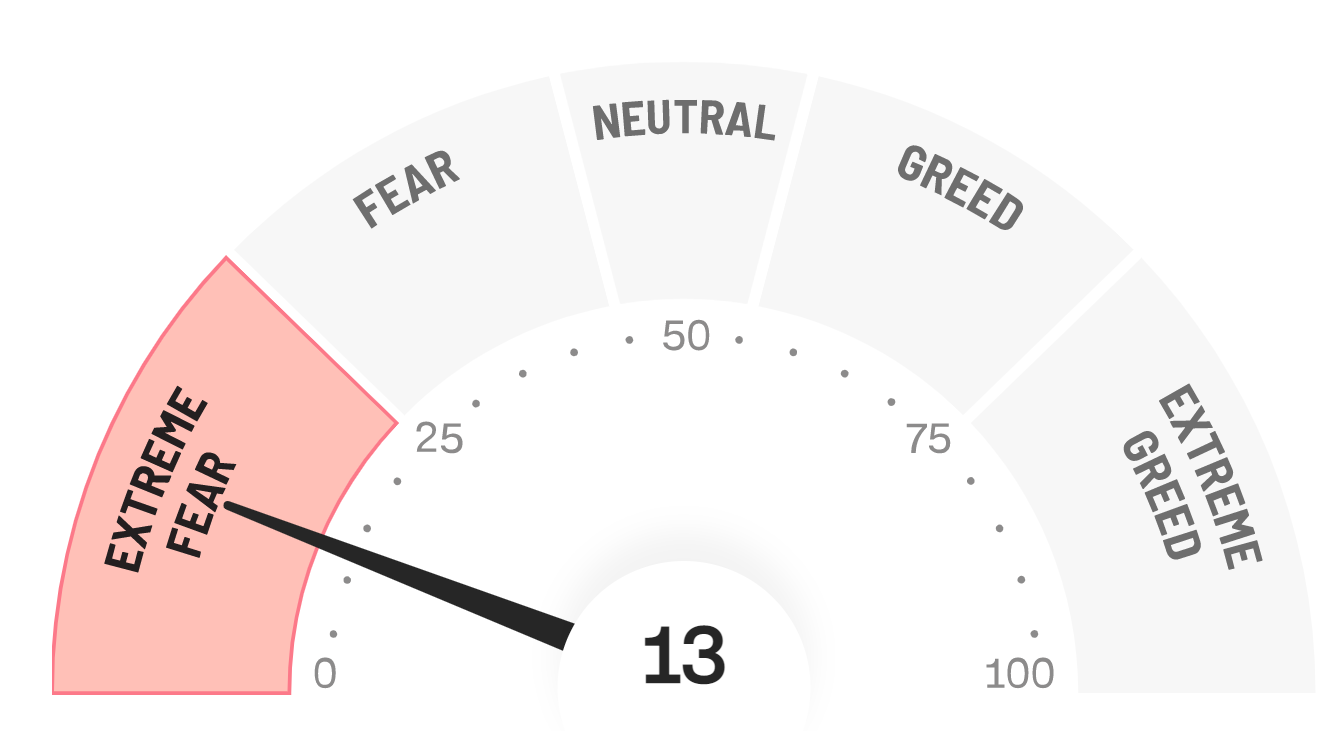
The digital currency market isn’t any calmer. The Crypto Fear & Greed Index, which is also based on several technical indicators, reads quite similarly:

Neither reading is much of a surprise considering rampant inflation, expected rate hikes, looming layoffs, and the threat of a long-lived recession. However, contrary to what these readings suggest, this level of fear could be good news.
Here’s an excerpt from a recent Barron’s post that suggests we may be headed toward greener pastures. (Emboldened for emphasis)
The market’s decline has landed an unusually large number of stocks below their 50-day moving averages. That’s a longer trend, so when a stock falls below it, that signals weakening investor confidence. Only 4.6% of S&P 500 stocks are trading above their 50-day moving averages, according to Dow Jones Market data. That’s the lowest since April 1, 2020, the early days of Covid-19 lockdowns.
When fewer than 5% of the index’s stocks are above their 50-day moving averages, the index goes on to gain 23% for the following year on average dating back to 1990, according to Truist. And however large the gains are, the index rises every time.
Three Eye-Opening Tweets
And finally, we close with three tweets:
Retail growth (sans auto) seems to mostly be in good shape.

Growth stocks: Out. Value stocks: In.

All hail Google, the King of Browsers. RIP Internet Explorer. (We won’t miss you.)

Thanks for reading. Don’t forget to hit the heart button if you enjoyed today’s report.
If you haven’t subscribed already, you can do so here.